Using O Notation Beyond Algorithm Analysis
The term Big O, which we know from mathematical analysis, was introduced by Paul Bachmann in the late 19th century to describe asymptotic function behavior. In the late 1970s, Donald Knuth decided to use it to evaluate algorithm efficiency in terms of time and memory complexity. This familiarized the majority of developers with the Big O. An understanding of the asymptotic behavior of processing time or memory footprint allows selecting the method most appropriate to current requirements. Bad asymptotic behavior allows rejecting the inadequate method immediately.
The idea that I’d like to share is not that deep: on the contrary, it’s right on the surface, but not everyone notices it. You can use methods similar to algorithm analysis for evaluating the asymptotic behavior of the software development project management system parameters. These include the total time and new feature development costs.
For instance, scalability is often cited as one of the advantages of a certain product. However, instead of using this rather vague term, we can state that the asymptotic behavior of productive capacity or administration costs in relation to the number of system users/programming modules/instances is, let’s say, not inferior to O(N). If that’s not the case, then scalability is nothing but a euphemism for the marketing smoke and mirrors.
On the other hand, some projects are described as collapsing under their own weight. A project may have started off well, but its architecture was structured in a way that the bad asymptotic behavior of alteration costs ruined it.
Let’s examine three examples that describe seemingly different effects, which turn out to have a lot in common upon closer examination.
Example 1
Every developer has faced a situation when the program, which used to manage its task perfectly with a small initial dataset, began to stall as soon the volume of information increased. It seemed that nothing could go wrong — we were convinced that all the kinks were worked out and the ten-record test set took all the variants into account. The future users were also satisfied — they’ve checked everything against the initial dataset, their critical remarks were taken into account, and they believed that the software could be used in a runtime environment. A catastrophe ensues when the program is launched: it’s unable to function in a runtime environment and everything freezes up.
The reason is, of course, the choice of a suboptimal algorithm or data structure. With a seemingly harmless nested loop or convenient API call, which worked fast on a small number of elements (like adding elements one-by-one to a dynamic array), we get a system with an O(n2) increase in operation time as a function of the number of elements. To avoid such issues, some hands-on experience and cracking open an algorithm and data structure textbook are enough. So, let’s not dwell on this example.
Example 2
Development project leaders are well aware of how the general order of things may deteriorate and grow complicated with the engagement of a new developer — unless you manage to give them a discrete, isolated task. The law described in the Fred Brooks’ classic The Mythical Man-Month states, “adding human resources to a late software project makes it later.” This statement has a very simple and mathematically precise explanation.
The dependence of time required for a development project on the number of people involved is established by Brooks as follows: Let be the number of developers working on the project. The total amount of work comprises:
-
Tasks that cannot be partitioned. Their completion time does not depend on the number of developers and equals .
-
Tasks that can be partitioned. Their completion time decreases with an increase in the number of developers and equals .
-
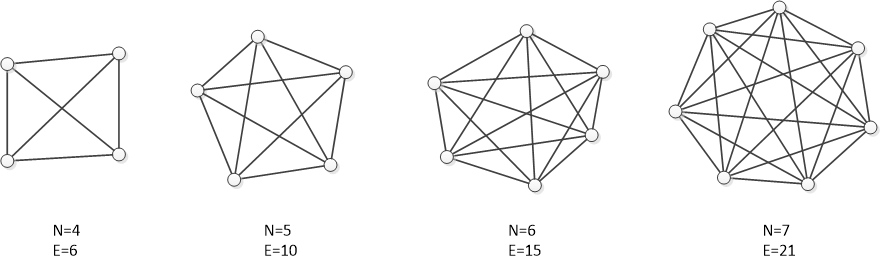
Exchange of information. Brooks writes, “If each part of the task must be separately coordinated with each other part, the effort increases as .” This means that if there are ndevelopers, the amount of effort spent on coordinating everyone is proportional to the number of links in a complete graph (a graph where each pair of vertices is connected):
Since the efforts are distributed between developers, their contribution to the completion time is described as .
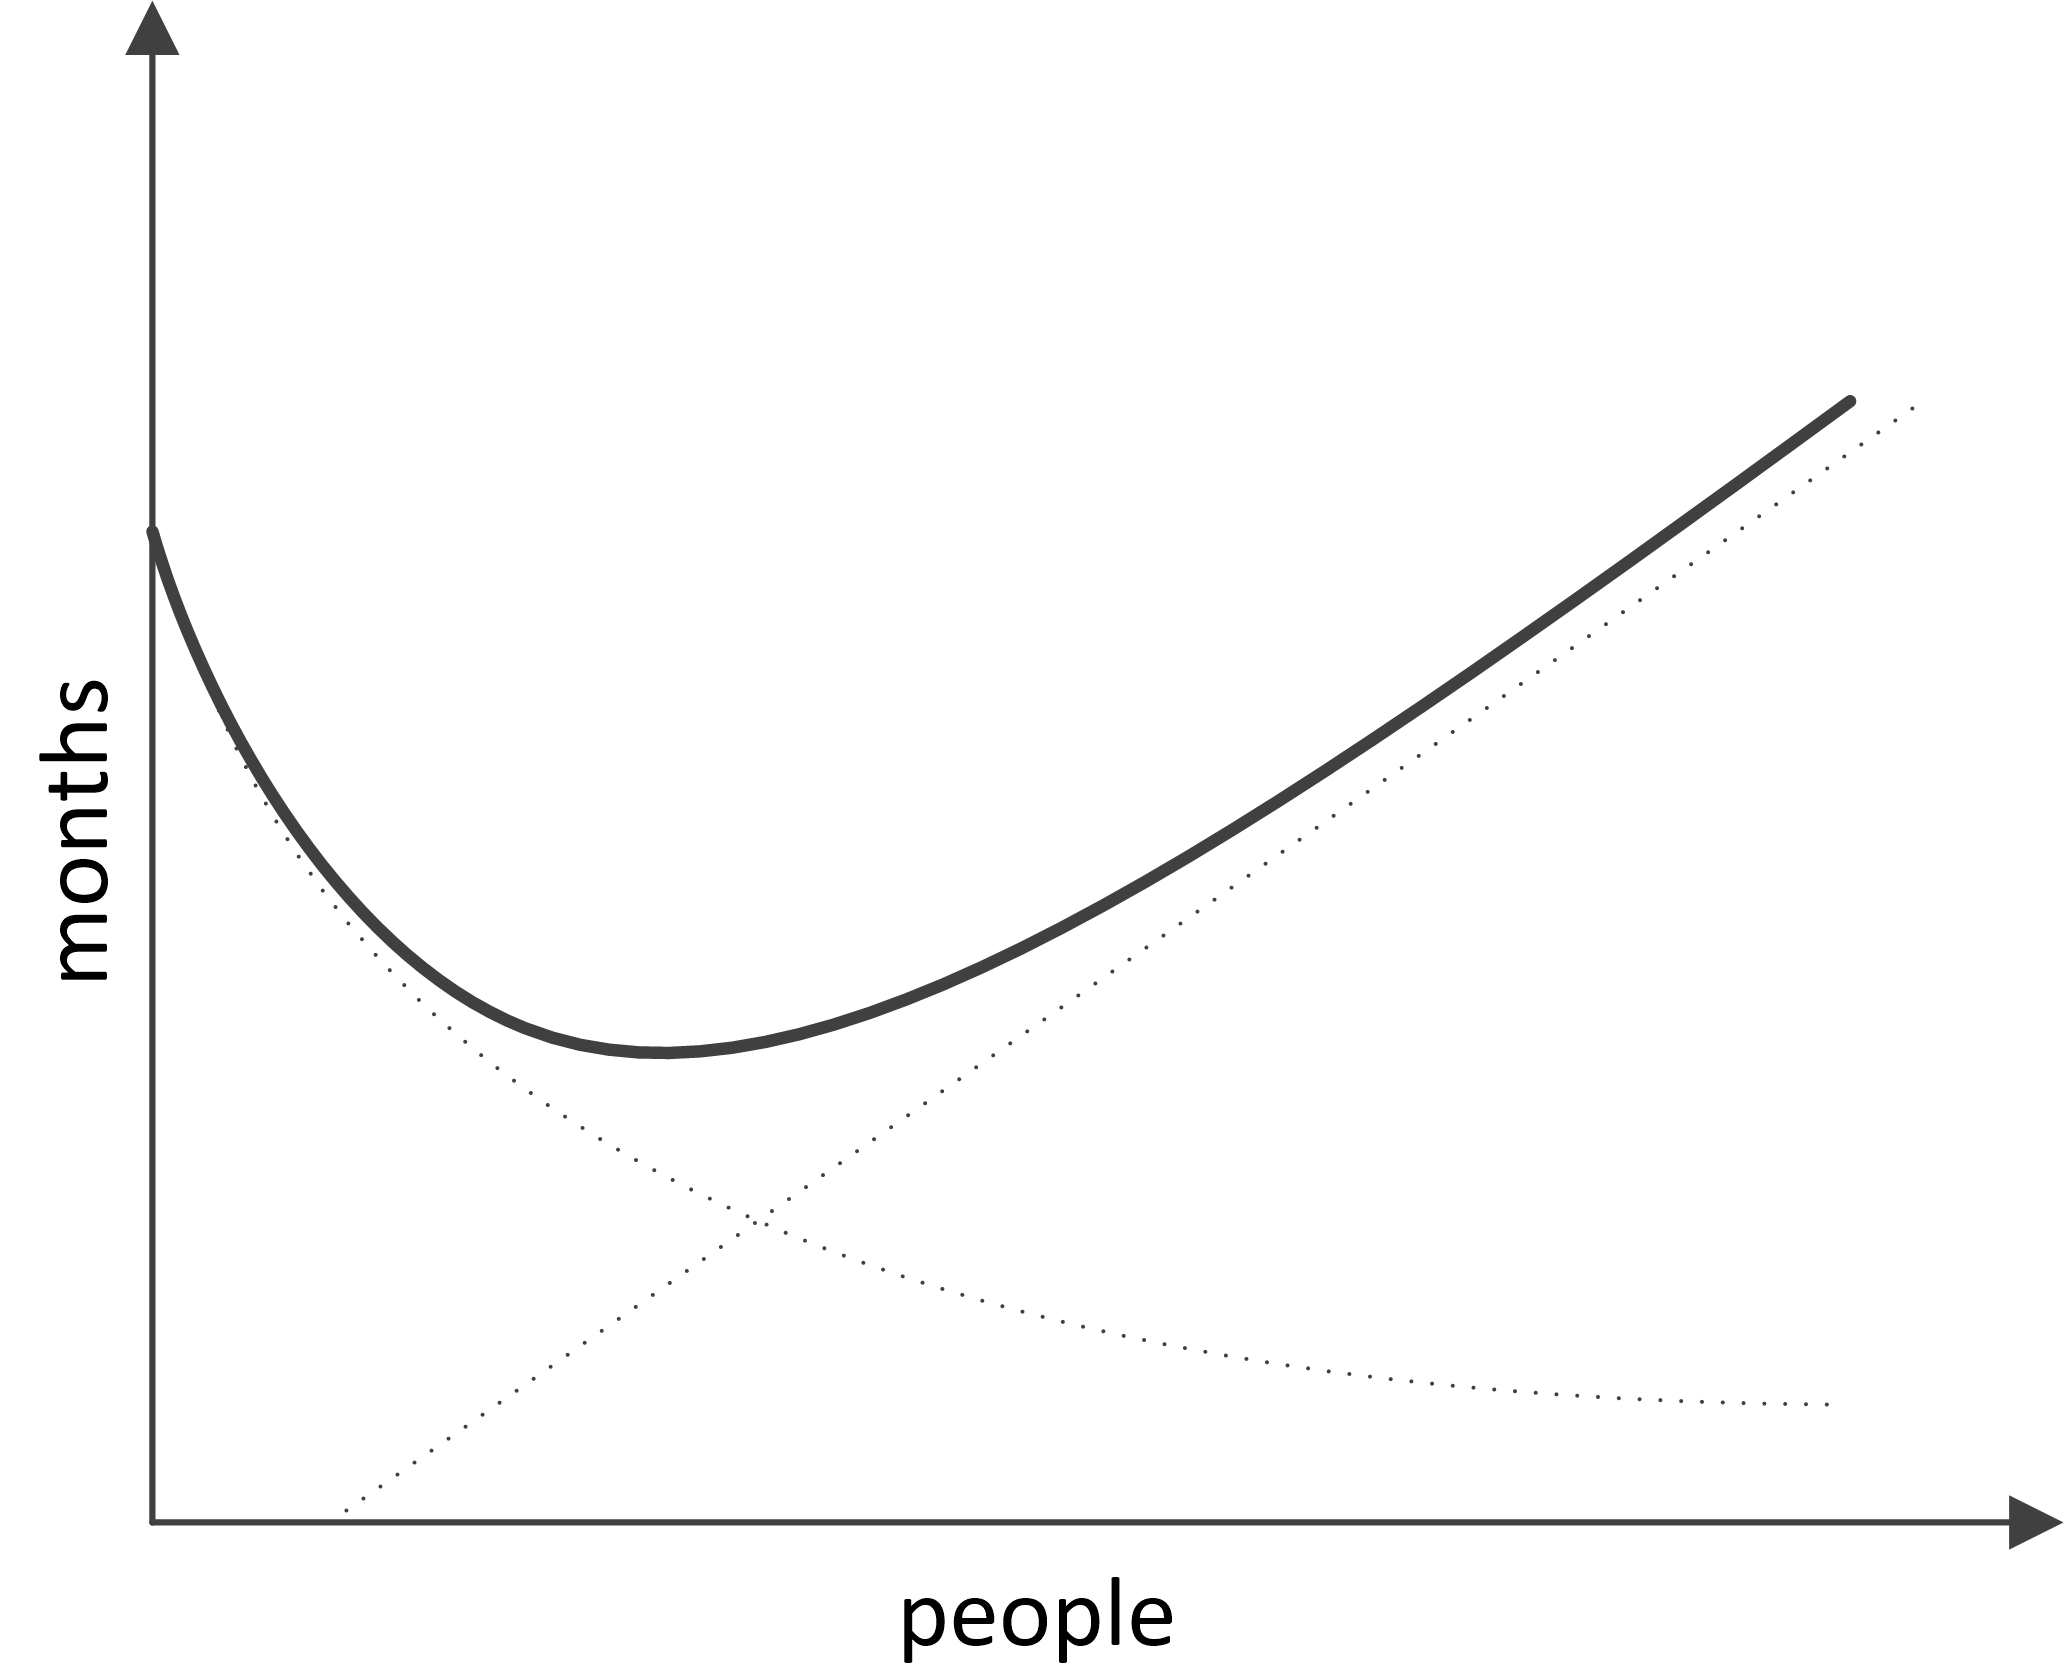
Thus, the total time required for project completion is defined by the following curve:
With the following graph:
Meanwhile, the efforts in man-hours are determined by the following formula:
The key idea proposed by F. Brooks states that the increase in the number of developers in a team leads to a decrease in project completion time only to a certain extent, after which an increase of completion time occurs. Applying O notation to the obtained patterns, we can state that in a Brooks project, the completion time increases with an increase in the number of developers as O(n) and the project cost as O(n2).
This is essential knowledge for a project leader who has to decide whether or not to engage new developers in a project that’s pressed for time, right?
Example 3
Another classic example of a badly growing dependence is cited in all Agile methodology books. It’s the increase in cost of change as a function of the project age.
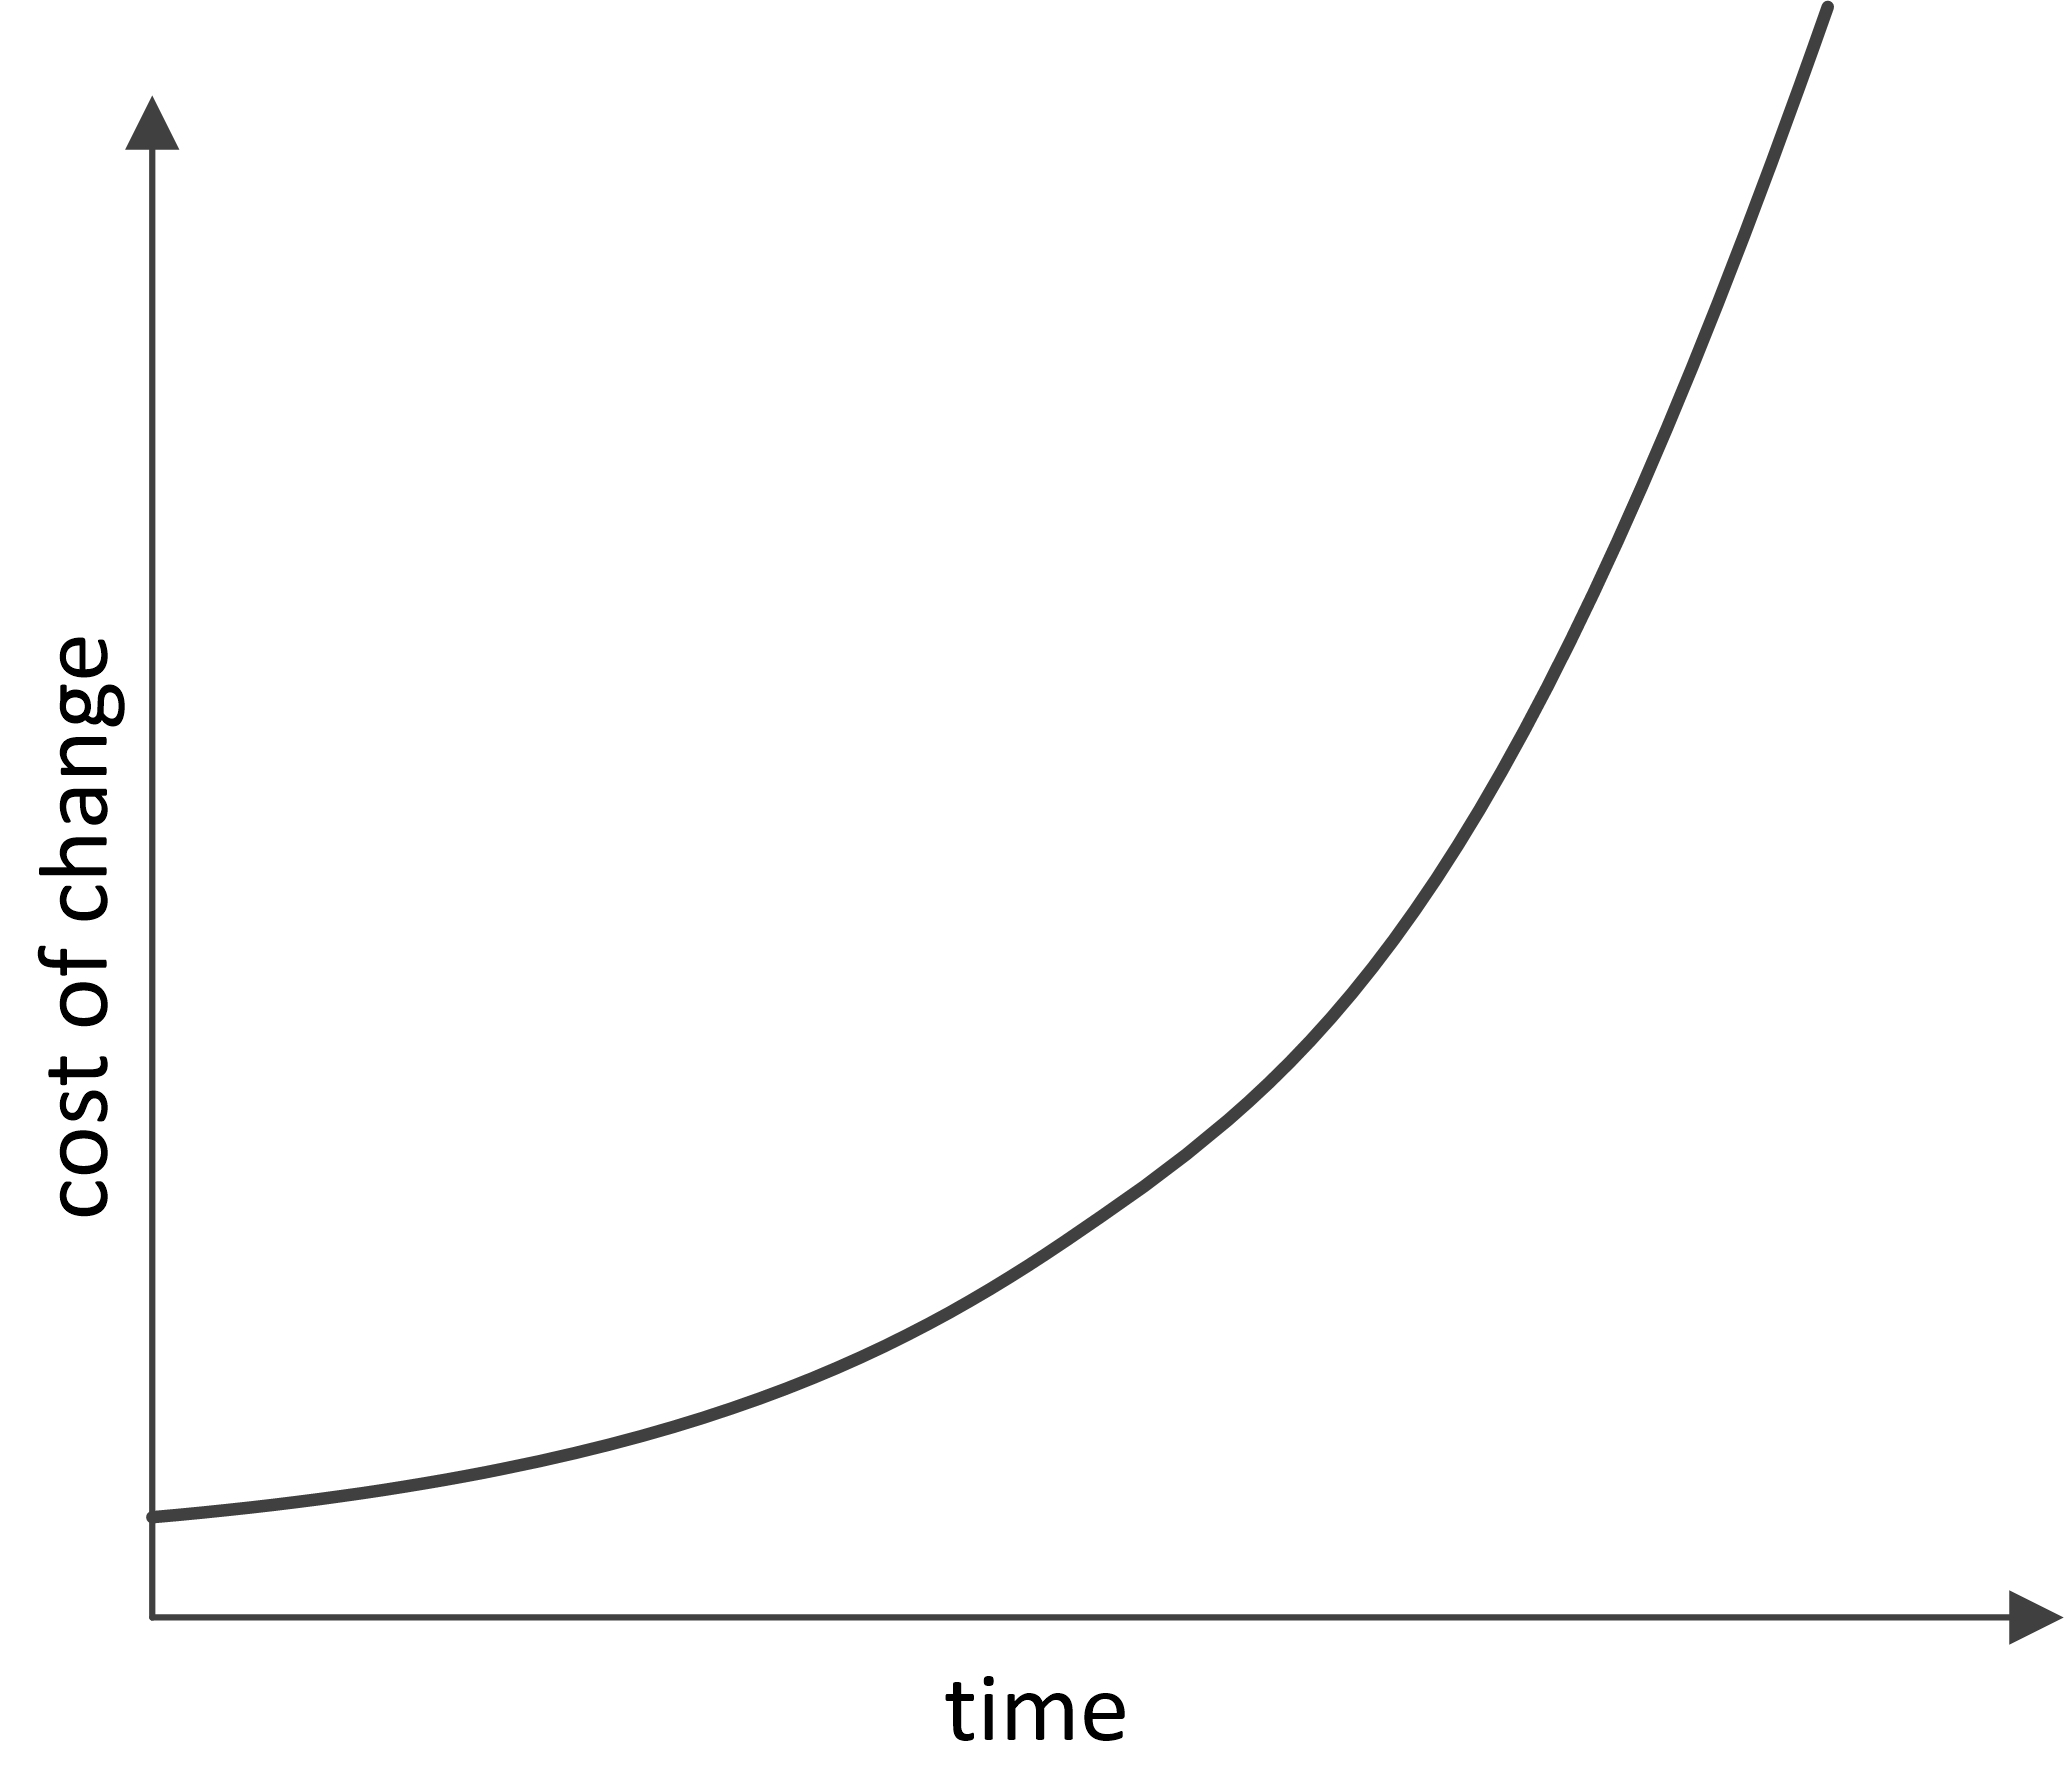
Once again, explaining this dependence is easy if you realize that the development of a programming project begins to resemble a complete graph, where project-related artifacts (programming modules, requirements, tests, documentation) are the vertices:
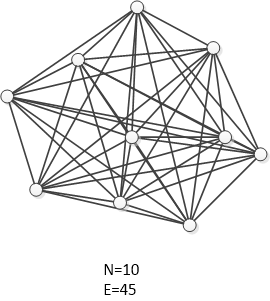
The introduction of each subsequent vertex to this graph costs more and more each time since more and more links with the already existing vertices emerge. Moreover, it often requires an upgrade of the existing vertices, which are linked to the new one (changes in the interface, tests, documentation). Afterward, alterations begin cascading in an avalanche-like manner until homeostasis is attained. Depending on how the connections between the artifacts function in a project, we can obtain a polynomial with a large power coefficient O(nk). The cost of change increases as a function of the already existing project artifacts.
As a result of this activity, at some point, the project development stalls, all the time is wasted on dealing with old issues, new alterations are introduced at an unacceptably slow rate, and, with colossal difficulties, developers keep saying that “everything has to be rewritten” — in other words, the project begins to collapse under its own weight.
Conclusion
Despite the fact that the examples cited describe entirely different effects, it’s easy to see that they have a lot in common: everything started off well and ended badly. In all cases, this was due to the inability to evaluate the asymptotic behavior of the key system parameters during further development.
In the first case, the problem is resolved by the choice of algorithm or data structure with proper asymptotic behavior.
In the second and third examples, the problem is in the non-linear growth of the number of connections in a complete graph. If your system resembles a complete graph, there’s no reason to expect that an increase in the number of elements will lead to positive consequences. A model of a graph with connections has an illustrative or qualitative rather than quantitative nature, and the connection graph does not need to be complete in the strict sense of the word. For Brooks’ Law and the cost of change growth effect to manifest, the graph only needs to have a tendency towards completeness. On the other hand, the least number of connections that a graph with of vertices can have is equal to , such as, for example, in a star-type graph:
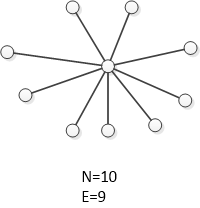
If the connections within a system are structured in a star-like manner, in a linear fashion, or in any other way that creates O(n) edges with n vertices, we get a system that behaves in a qualitatively different manner when growing: the cost of adding a new vertex in such a system is always a constant.
Just a few words on how to obtain this result in practice. Generally, all aspects of the project should be optimized: from program architecture to project specialist labor management.
When designing an application, we can utilize the star-like quality of the platform-plugins architecture. It has a certain basic segment — the application’s core or platform — which is developed with all possible meticulousness and rarely altered. All of the application’s functions use the core’s services and interact with each other only through the core. Meanwhile, the core itself does not depend on plugins.
In object-oriented development, this principle can be conveniently implemented via the source-subscriber pattern, and particularly via the mediator pattern.
In distributed environments, we can utilize message brokers.
Considering the above, it is clear that some initial overhead expenses for programming such architecture are compensated later by the savings on the interaction between add-ins’ developers and the coordination of add-ins among themselves. Task partitioning becomes possible, and engaging new developers in the project becomes simple and safe.
The effect described by Brooks should also be diminished by managing intra-project communications (a decrease in the quadratically growing part of labor efforts). For instance, general employee briefings and blanket e-mail newsletters with the maximum of information on current operations allow each of the participants to interact with the “central vertex” without the need to search for the proper addressee. Project managers are aware that communication problems are not merely limited to huge projects; they emerge even when four participants are involved and as the project grows, they can reach truly cosmic dimensions.
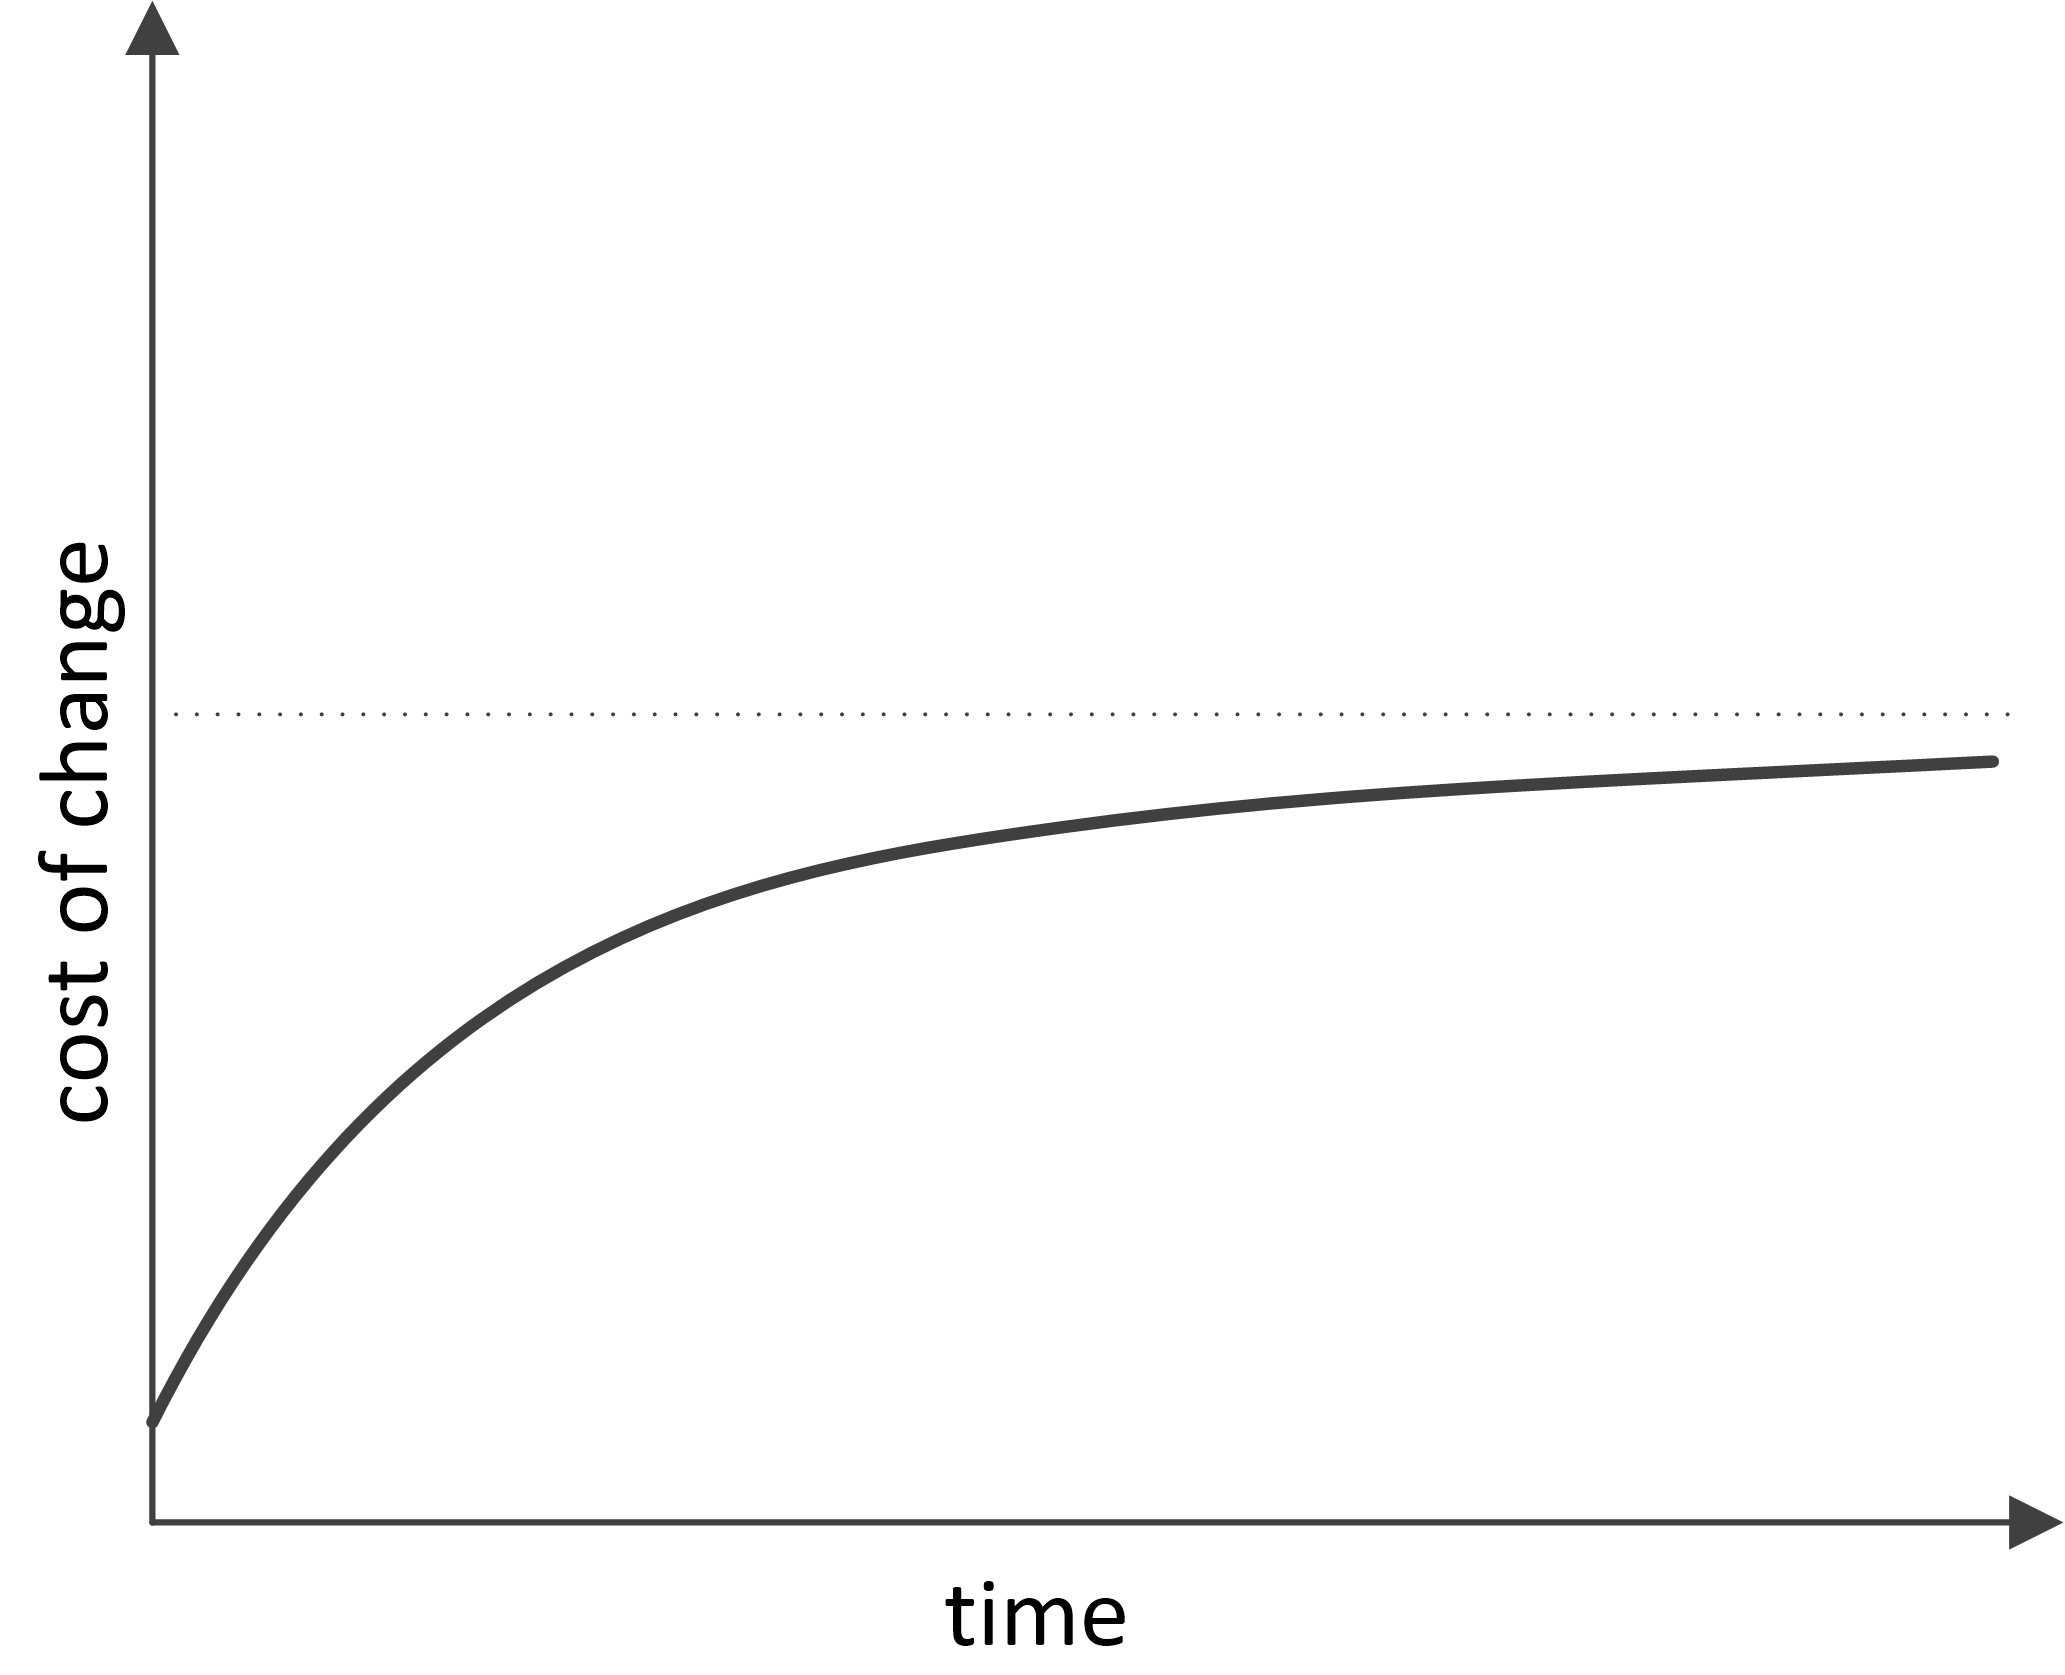
The Agile approach provides a whole set of measures to attain O(1)-asymptotic behavior of the alteration cost increase. Besides the importance of communication management (including such radical methods as paired programming), special attention is heeded to development via testing. It involves the creation of rigid and isolated ‘functional requirement-test-code’ links that do not lead to the emergence of extraneous connections and all-around dependencies. The perfect dependence of alteration cost on the phase of the project, according to Agile, is as follows:
As mentioned before, the idea articulated in this article lays on the surface. We, the developers, can evaluate the algorithm’s behavior as the task grows more complex. So, why not begin similarly forecasting the development project parameter behavior as the project grows and develops? We can optimize algorithms and get rid of unnecessary cycles and calculations. Why not optimize the entire development project, clearing out unneeded connections and dependences?
You might also be interested in reading Developing Leaders: What to Do When Your Team Grows Too Big (more complete graphs!).